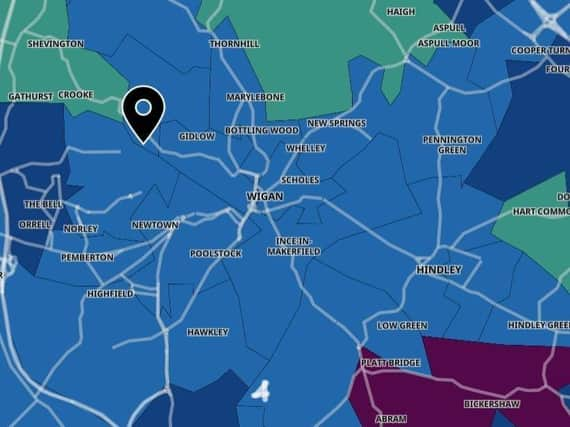
Out of 28 areas mapped, only seven showed a decrease in cases with one showing no change in the week ending July 7.
Images are used for illustrative purposes only and not directly linked to the data.
Thanks for reading. If you value what we do and are able to support us, a digital subscription is just £1 for your first month. Try us today by clicking here and viewing our offers.
Images are used for illustrative purposes only and not directly linked to the data.
2 / 7
