

Following a relatively quite period a few months ago, 26 out of 27 areas mapped today have shown an increase in cases with only Orrell showing a drop in cases according to the latest ONS data, which can be found here.
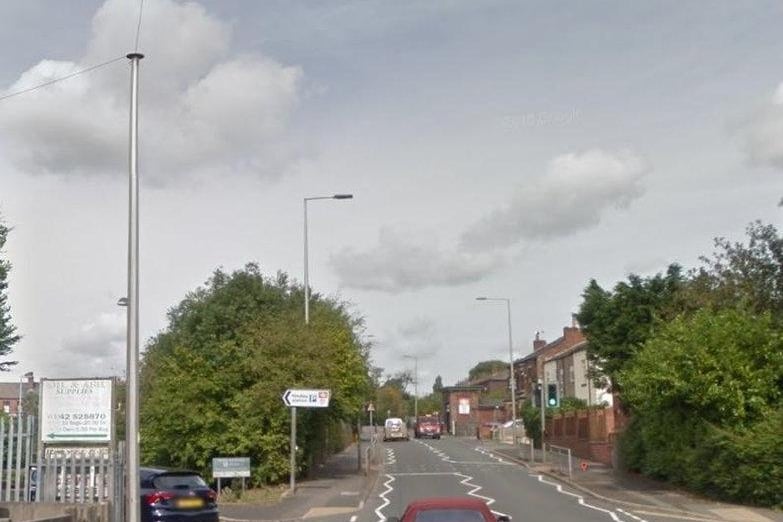
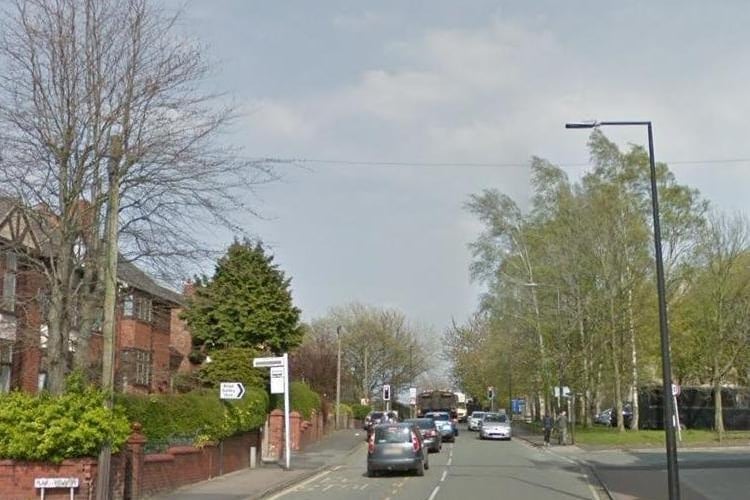
Here they are, ranked in order from lowest to highest to the week ending June 9 from June 2. Pictures are for illustrative purposes only and not linked to the data.
Thanks for reading. If you value what we do and are able to support us, a digital subscription is just £1 for your first month. Try us today by clicking here and viewing our offers.
Thanks for reading. If you value what we do and are able to support us, a digital subscription is just £1 for your first month. Try us today by clicking here and viewing our offers.

7 / 7