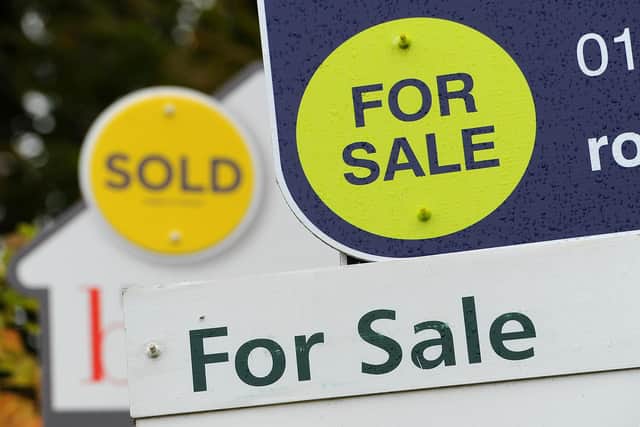
Wigan house prices dropped more than North West average in February
and live on Freeview channel 276
But the drop does not reverse the longer-term trend, which has seen property prices in the area achieve 11.5 per cent annual growth.
The average Wigan house price in February was £188,750, Land Registry figures show: almost one per cent less than in January.
Advertisement
Hide AdAdvertisement
Hide Ad
Over the month, the picture was similar to that across the North West, where prices decreased 0.6 per cent, and Wigan outperformed the one per cent drop for the UK as a whole.
Over the last year, the average sale price of property in Wigan rose by £20,000 – putting the area sixth among the North West’s 35 local authorities with price data for annual growth.
The best annual growth in the region was in Fylde, where property prices increased on average by 14.2 per cent, to £247,000. At the other end of the scale, properties in Westmorland and Furness gained just 2.4 per cent in value, giving an average price of £224,000.
Winners and Losers
Owners of terraced houses fared worst in Wigan in February – they dropped 1.1 per cent in price, to £143,948 on average. But over the last year, prices rose by 11 per cent.
Among other types of property:
Advertisement
Hide AdAdvertisement
Hide AdDetached: down 0.5 per cent monthly; up 13.1 per cent annually; £318,626 average;
Semi-detached: down 0.9 per cent monthly; up 11.4 per cent annually; £189,953 average;
Flats: down 0.7 per cent monthly; up 9.1 per cent annually; £98,729 average.
First steps on the property ladder
First-time buyers in Wigan spent an average of £167,000 on their property – £17,000 more than a year ago, and £52,000 more than in February 2018.
Advertisement
Hide AdAdvertisement
Hide AdBy comparison, former owner-occupiers paid £211,000 on average in February – 26.3 per cent more than first-time buyers.
How do property prices in Wigan compare?
Buyers paid 11.9 per cent less than the average price in the North West (£214,000) in February for a property in Wigan. Across the North West, property prices are lower than those across the UK, where the average cost £288,000.